
Performance profiling is a subject I am only starting to explore.
I have been developing software for several years, but I have never used a profiler to investigate a real production incident. I had some basic knowledge of profiling, but I did not have a clear method for connecting a slow response to what the JVM was actually doing.
Performance itself was not new to me. During a client project, I had used JMeter to test a REST service. I had also introduced caching and database indexes to help the service meet its performance targets.
More recently, my reading introduced me to VisualVM and ZGC. This made me look at that earlier experience differently. I had already measured performance and improved it, but I was still observing the application mainly from the outside.
The next natural step was to see how these ideas connect. I built a small Spring Boot application and used it to explore the path from a visible performance symptom to the internal questions that profiling can answer.
What I already knew from JMeter
In that client project, JMeter allowed me to generate load against a REST service and observe its response times. I could run the same scenario before and after a change, then check whether the service reached the expected performance targets.
This was useful when I introduced caching and database indexes. The tests gave me evidence that the changes improved the behavior seen by the client.
I had learned an important part of performance work:
A change is not a performance improvement until we measure its effect.
However, JMeter did not tell me in detail what happened inside the JVM. It showed the result of the work, but not how the application spent CPU time, allocated objects, used threads, or triggered garbage collection.
My decisions about caching and indexing came from my understanding of the application and its database access. They were useful changes, but they were not conclusions produced by a JVM profile.
That difference between observing an effect and investigating its internal cause was the part I had been missing.
What profiling adds to the picture
JMeter and a profiler answer different questions.
JMeter observes the application from the outside:
How does the system behave under this load?
A profiler observes it from the inside:
What is the JVM doing while the system behaves this way?
A load test can show that an endpoint becomes slow. A CPU profile may then show which methods use the processing time. A memory profile may reveal excessive allocations. Thread information may show contention or waiting. Garbage-collection data may explain pauses or unstable latency.
These tools are not alternatives. A repeatable load creates the conditions in which a profiler can observe the application.
This gave me a clearer workflow:
Create a repeatable load
          ↓
Observe a symptom
          ↓
Profile the application
          ↓
Form a hypothesis
          ↓
Change one thing
          ↓
Run the same load again
I wanted a small example that could make this workflow concrete.
Building a small performance problem
I created a Spring Boot application with an endpoint that builds a text report. The problem is intentional: the method repeatedly adds rows to an immutable String.
public WorkResult buildInefficientReport(int items) {
    String report = "";

    for (int index = 0; index < items; index++) {
        report = report + row(index);
    }

    return result("string-concatenation", items, report);
}
The shared row method is simple:
private String row(int index) {
    return "order-" + index + ":amount-" + (index * 31L) + '\n';
}
Every loop creates a new result and copies the content that was already built. As the report grows, the JVM has more characters to copy and more temporary objects to manage.
The endpoint accepts the report size as a parameter:
GET /api/work/inefficient?items=2500
It returns only the number of characters and a checksum. This keeps the HTTP response small while confirming that the complete report was generated.
{
    "implementation": "string-concatenation",
    "items": 2500,
    "characters": 58529,
    "checksum": 375021640
}
This example is deliberately simple. Because I created the bottleneck myself, the goal was not to discover a surprising production problem. It was to understand how load testing, profiling, and verification should connect.
JMeter revealed the symptom
I started the application with a fixed 256 MB heap and G1 GC. I then created a JMeter scenario with eight threads, a five-second ramp-up, and a total duration of 30 seconds.
Each request asked the endpoint to generate 2,500 report rows. JMeter also checked that every response returned HTTP 200.
The first run produced these results:
| Measurement | String concatenation |
|---|---|
| Samples | 15,782 |
| Errors | 0 |
| Average response time | 14.01 ms |
| Median | 14 ms |
| 95th percentile | 16 ms |
| 99th percentile | 20 ms |
| Maximum | 111 ms |
| Throughput | 526.72 req/s |
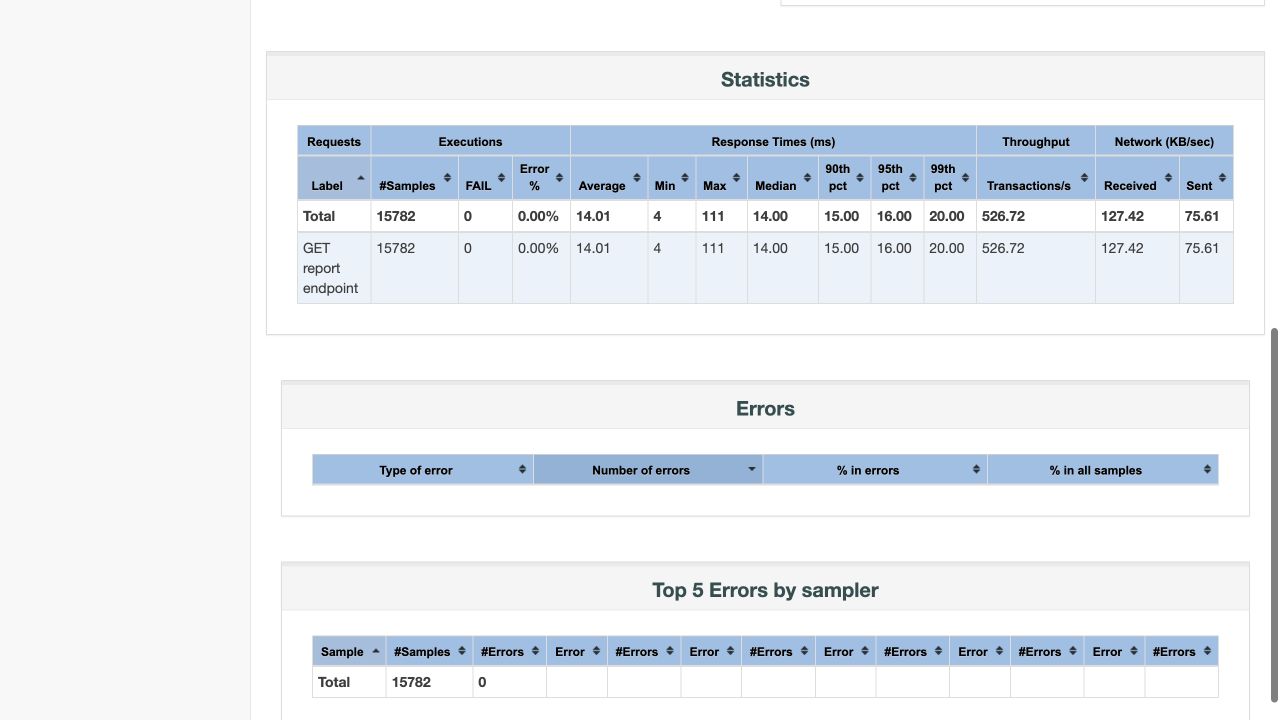
JMeter made the cost visible from the client side. It did not explain why the method was expensive.
This is the point where load testing stops and profiling begins.
Where VisualVM enters the investigation
VisualVM was the first tool that helped me understand what an internal JVM investigation could look like. It brings several views together: CPU activity, heap usage, loaded classes, threads, garbage collection, CPU sampling, and memory sampling.
For this lab, the profiling sequence is:
- Start the Spring Boot application with the controlled heap.
- Open VisualVM and select the local
profiling-labprocess. - Open Monitor to observe CPU, heap, threads, and garbage collection.
- Start CPU sampling immediately before the JMeter scenario.
- Stop sampling when the load test ends.
- Inspect
ReportService.buildInefficientReportand the calls below it. - Repeat with memory sampling to inspect the objects created during the test.
The sampling window matters. Including application startup, a long idle period, or several different scenarios in the same sample would make the result harder to understand.
At the time of writing, the JMeter measurements are complete, but I have not completed the VisualVM sampling session. I am therefore not presenting expected CPU or allocation data as measured results.
This limitation also changes how the experiment should be read. The inefficient code was created intentionally, so I already knew where to look. In a real investigation, I should profile the slow version before choosing a correction. Otherwise, I would return to guessing from the source code.
Changing one thing
For the second implementation, I replaced repeated concatenation with one pre-sized StringBuilder:
public WorkResult buildOptimizedReport(int items) {
    StringBuilder report = new StringBuilder(items * 24);

    for (int index = 0; index < items; index++) {
        report.append(row(index));
    }

    return result("string-builder", items, report.toString());
}
The row generation and final result remained unchanged. I also added a test to compare the number of characters and checksum returned by both implementations:
@Test
void bothImplementationsProduceTheSameReportSignature() {
    WorkResult inefficient = reportService.buildInefficientReport(2_500);
    WorkResult optimized = reportService.buildOptimizedReport(2_500);

    assertThat(optimized.items()).isEqualTo(inefficient.items());
    assertThat(optimized.characters()).isEqualTo(inefficient.characters());
    assertThat(optimized.checksum()).isEqualTo(inefficient.checksum());
}
This verification matters. A faster method is not an optimization if it produces a different result.
Running the same load again
I exposed the new implementation through a second endpoint:
GET /api/work/optimized?items=2500
I then ran the same JMeter plan with the same thread count, ramp-up, duration, and report size.
| Measurement | String concatenation | StringBuilder |
|---|---|---|
| Samples | 15,782 | 812,705 |
| Errors | 0 | 0 |
| Average response time | 14.01 ms | 0.26 ms |
| Median | 14 ms | below 1 ms |
| 95th percentile | 16 ms | 1 ms |
| 99th percentile | 20 ms | 1 ms |
| Maximum | 111 ms | 62 ms |
| Throughput | 526.72 req/s | 27,135.39 req/s |
The optimized endpoint produced around 51.5 times more throughput in this local scenario.
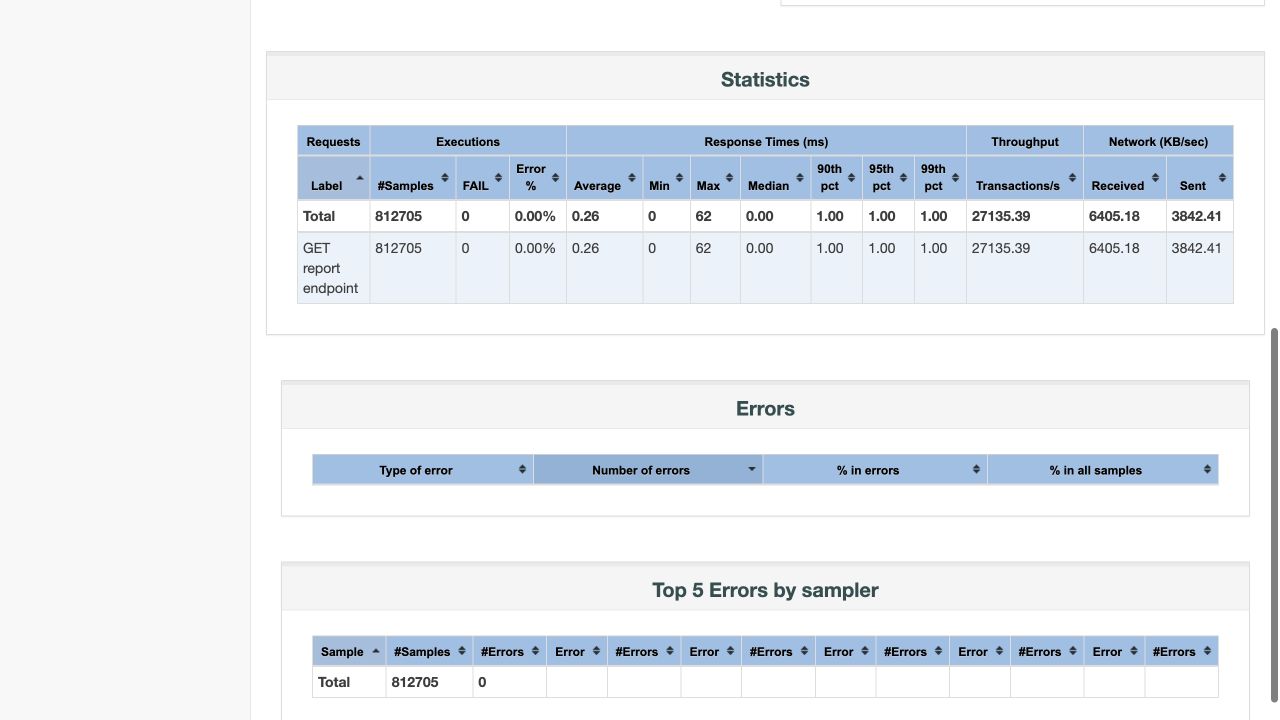
The optimized average was below one millisecond. JMeter records response times in milliseconds in this configuration, which is why the median is displayed as 0. At this level, throughput and percentiles are more useful than the rounded median.
What the comparison does and does not prove
This was an exploration, not a general benchmark of String and StringBuilder.
The performance problem was created on purpose. Both JMeter and the Spring Boot application ran on the same computer. When the endpoint became very fast, the load generator, HTTP stack, operating system, and local machine could all become part of the limit.
The two scenarios were also executed once and in a fixed order. The second run may have benefited from JVM warm-up and JIT compilation. The difference is large enough to make the direction clear, but the exact multiplier should not be treated as a universal result.
A stricter comparison would:
- warm up each endpoint before recording results;
- restart the application between scenarios;
- run each scenario several times;
- alternate their execution order;
- compare the median results across those runs;
- run the load generator on a separate machine when the endpoint becomes very fast.
The result supports a smaller conclusion:
Under the same local load, removing the deliberately inefficient concatenation produced a major improvement.
It does not mean that every string concatenation should be replaced. A short expression such as firstName + " " + lastName is not the problem demonstrated here. The important condition is repeated concatenation of a growing value inside a loop.
Where ZGC fits—and where it does not
My reading about Java performance also led me to ZGC, the low-latency garbage collector in the JVM.
It would be easy to restart the lab with:
java -Xms256m -Xmx256m -XX:+UseZGC \
  -jar target/profiling-lab-0.0.1-SNAPSHOT.jar
-Xms256m and -Xmx256m set the initial and maximum heap to the same size. -XX:+UseZGC selects ZGC, and -jar starts the packaged Spring Boot application.
However, this would answer a different question.
The 256 MB heap is intentionally small for this local lab. It is not representative of the larger heaps and latency-sensitive workloads for which ZGC is commonly considered. A useful collector comparison should use a heap size and workload that reflect the constraints of the application being studied.
The problem in this example is unnecessary allocation and copying created by the application code. Changing the garbage collector may change pause behavior, but it does not remove that work. The first correction belongs in the code.
A useful ZGC comparison should keep the application code unchanged, create measurable garbage-collection pressure, record pause behavior, and compare collectors separately. Changing the code and the garbage collector at the same time would make the result impossible to explain clearly.
This was another important lesson from the discovery: change one variable, then measure again.
How to reproduce the experiment
The complete project is stored in the profiling-lab directory of the blog repository.
Environment used for my run
- Apple Silicon Mac running macOS 15.5;
- Eclipse Temurin Java 17;
- Spring Boot 4.1.0;
- Apache JMeter 5.6.3;
- VisualVM 2.2.1;
- a fixed JVM heap of 256 MB;
- G1 GC.
The exact numbers will change on another machine, but the experiment should show the same direction.
Java prerequisite
JMeter is a Java application. Check that Java is available:
java -version
This command prints the Java runtime and version found in the current terminal.
The official JMeter documentation supports Java 8 or later and recommends using a JDK. I used Java 17 for this experiment.
Installing JMeter on macOS
brew install jmeter
jmeter --version
The first command installs JMeter through Homebrew. The second confirms which version is available on the command line.
VisualVM can be installed separately:
brew install --cask visualvm
mdls -name kMDItemVersion /Applications/VisualVM.app
brew install --cask installs the macOS application, while mdls reads its installed version from the application metadata.
Installing JMeter on Windows
Download the binary ZIP from the official Apache JMeter download page. Do not download the source archive.
The same installation can be performed from PowerShell:
$version = "5.6.3"
$archive = "$env:TEMP\apache-jmeter-$version.zip"
$tools = "$env:USERPROFILE\tools"

Invoke-WebRequest `
  -Uri "https://dlcdn.apache.org/jmeter/binaries/apache-jmeter-$version.zip" `
  -OutFile $archive

New-Item -ItemType Directory -Force -Path $tools
Expand-Archive -Path $archive -DestinationPath $tools -Force

& "$tools\apache-jmeter-$version\bin\jmeter.bat" --version
The script stores the selected version and paths in variables, downloads the binary ZIP, extracts it into the user's tools directory, and prints the installed version.
Open the JMeter GUI with:
& "$env:USERPROFILE\tools\apache-jmeter-5.6.3\bin\jmeter.bat"
jmeter.bat is the Windows launcher included in the archive.
Use the same script with -n for an actual load test instead of generating load from the GUI.
Installing JMeter on Ubuntu
Install a JDK and the download tools:
sudo apt update
sudo apt install -y openjdk-17-jdk curl
java -version
apt update refreshes the package list, and apt install adds Java 17 and curl. The final command verifies Java.
Then download and extract the official binary archive:
JMETER_VERSION=5.6.3
TOOLS_DIR="$HOME/tools"

mkdir -p "$TOOLS_DIR"
curl -fL \
  "https://dlcdn.apache.org/jmeter/binaries/apache-jmeter-${JMETER_VERSION}.tgz" \
  -o "/tmp/apache-jmeter-${JMETER_VERSION}.tgz"

tar -xzf "/tmp/apache-jmeter-${JMETER_VERSION}.tgz" -C "$TOOLS_DIR"

export JMETER_HOME="$TOOLS_DIR/apache-jmeter-${JMETER_VERSION}"
export PATH="$JMETER_HOME/bin:$PATH"

jmeter --version
This block downloads the JMeter archive, extracts it under $HOME/tools, defines its installation directory, and adds its bin directory to the current PATH.
The two export commands apply only to the current terminal. Add them to ~/.bashrc if JMeter should remain available in new terminal sessions.
Apache provides .zip and .tgz binary archives and recommends verifying their SHA-512 or PGP signature before use.
Building and starting the application
From the profiling-lab directory, run:
./mvnw clean verify
java -Xms256m -Xmx256m -XX:+UseG1GC \
  -jar target/profiling-lab-0.0.1-SNAPSHOT.jar
./mvnw clean verify removes the previous build, compiles the project, and runs its checks. The java command starts the resulting application with a fixed 256 MB heap and G1 GC.
On Windows, use mvnw.cmd clean verify for the build.
The application uses port 8095 because port 8080 was already in use on my machine. Check its health with:
curl http://127.0.0.1:8095/actuator/health
curl calls the Actuator health endpoint. A response with "status":"UP" confirms that the application is ready.
Running the JMeter scenarios
The test plan uses these parameters:
| Parameter | Value |
|---|---|
| Threads | 8 |
| Ramp-up | 5 seconds |
| Duration | 30 seconds |
| Report items per request | 2,500 |
| Target host | 127.0.0.1 |
| Target port | 8095 |
| Expected status | HTTP 200 |
Run the inefficient implementation:
jmeter -n \
  -t jmeter/profiling-load-test.jmx \
  -Jpath=/api/work/inefficient \
  -Jitems=2500 \
  -Jthreads=8 \
  -Jramp=5 \
  -Jduration=30 \
  -l evidence/inefficient/results.jtl \
  -e -o evidence/inefficient/report
Then run the optimized implementation with the same parameters:
jmeter -n \
  -t jmeter/profiling-load-test.jmx \
  -Jpath=/api/work/optimized \
  -Jitems=2500 \
  -Jthreads=8 \
  -Jramp=5 \
  -Jduration=30 \
  -l evidence/optimized/results.jtl \
  -e -o evidence/optimized/report
The main options are:
-nruns JMeter without the GUI;-tselects the.jmxtest plan;- each
-Joption passes a property to the plan; -lstores the raw samples in a.jtlfile;-e -ogenerates the HTML report in the selected directory.
JMeter should be used in CLI mode for the load itself; the GUI is useful for creating and debugging the plan.
What changed in my understanding
Before this discovery, I saw JMeter, VisualVM, and ZGC as separate performance topics.
I now understand their different roles more clearly. JMeter tells me what the client experiences. VisualVM can help me investigate what the JVM is doing. A garbage collector such as ZGC becomes relevant only when measurements and latency requirements point in that direction.
The experiment also showed me the limit of reading source code alone. In this controlled example, I created the problem and already knew where it was. In a real application, experience can suggest where to look, but a profile should help decide where to act.
I am still learning profiling, and the VisualVM sampling step remains part of that learning. However, the path is now clearer: reproduce the symptom, observe the application, form a hypothesis, change one thing, and measure again.
A slow response is a symptom. The real work begins when we measure why it is slow.
Continue the conversation
Share your perspective
Questions, counterpoints, and production experience are welcome. A GitHub account is required to comment.